


 Trusted Content
Key Takeaways
- California accounts for nearly a quarter of all U.S. bicycle injuries, with urban areas like Los Angeles and San Diego leading in accident numbers.
- Head injuries make up about one-third of non-fatal bike injuries, but helmet use can reduce that risk by up to 55%.
- Most fatal bicycle crashes happen in urban areas during summer months, with visibility and failure to yield as the top contributing factors.
Bicycling is a great way to enjoy the outdoors, exercise, and even commute, but it comes with real risks, especially in urban areas. Understanding bicycle accident statistics, including how common accidents are, where they happen, and when can help you stay informed and make safer choices when out on the road.
How Many Bicycle Accidents Per Year?
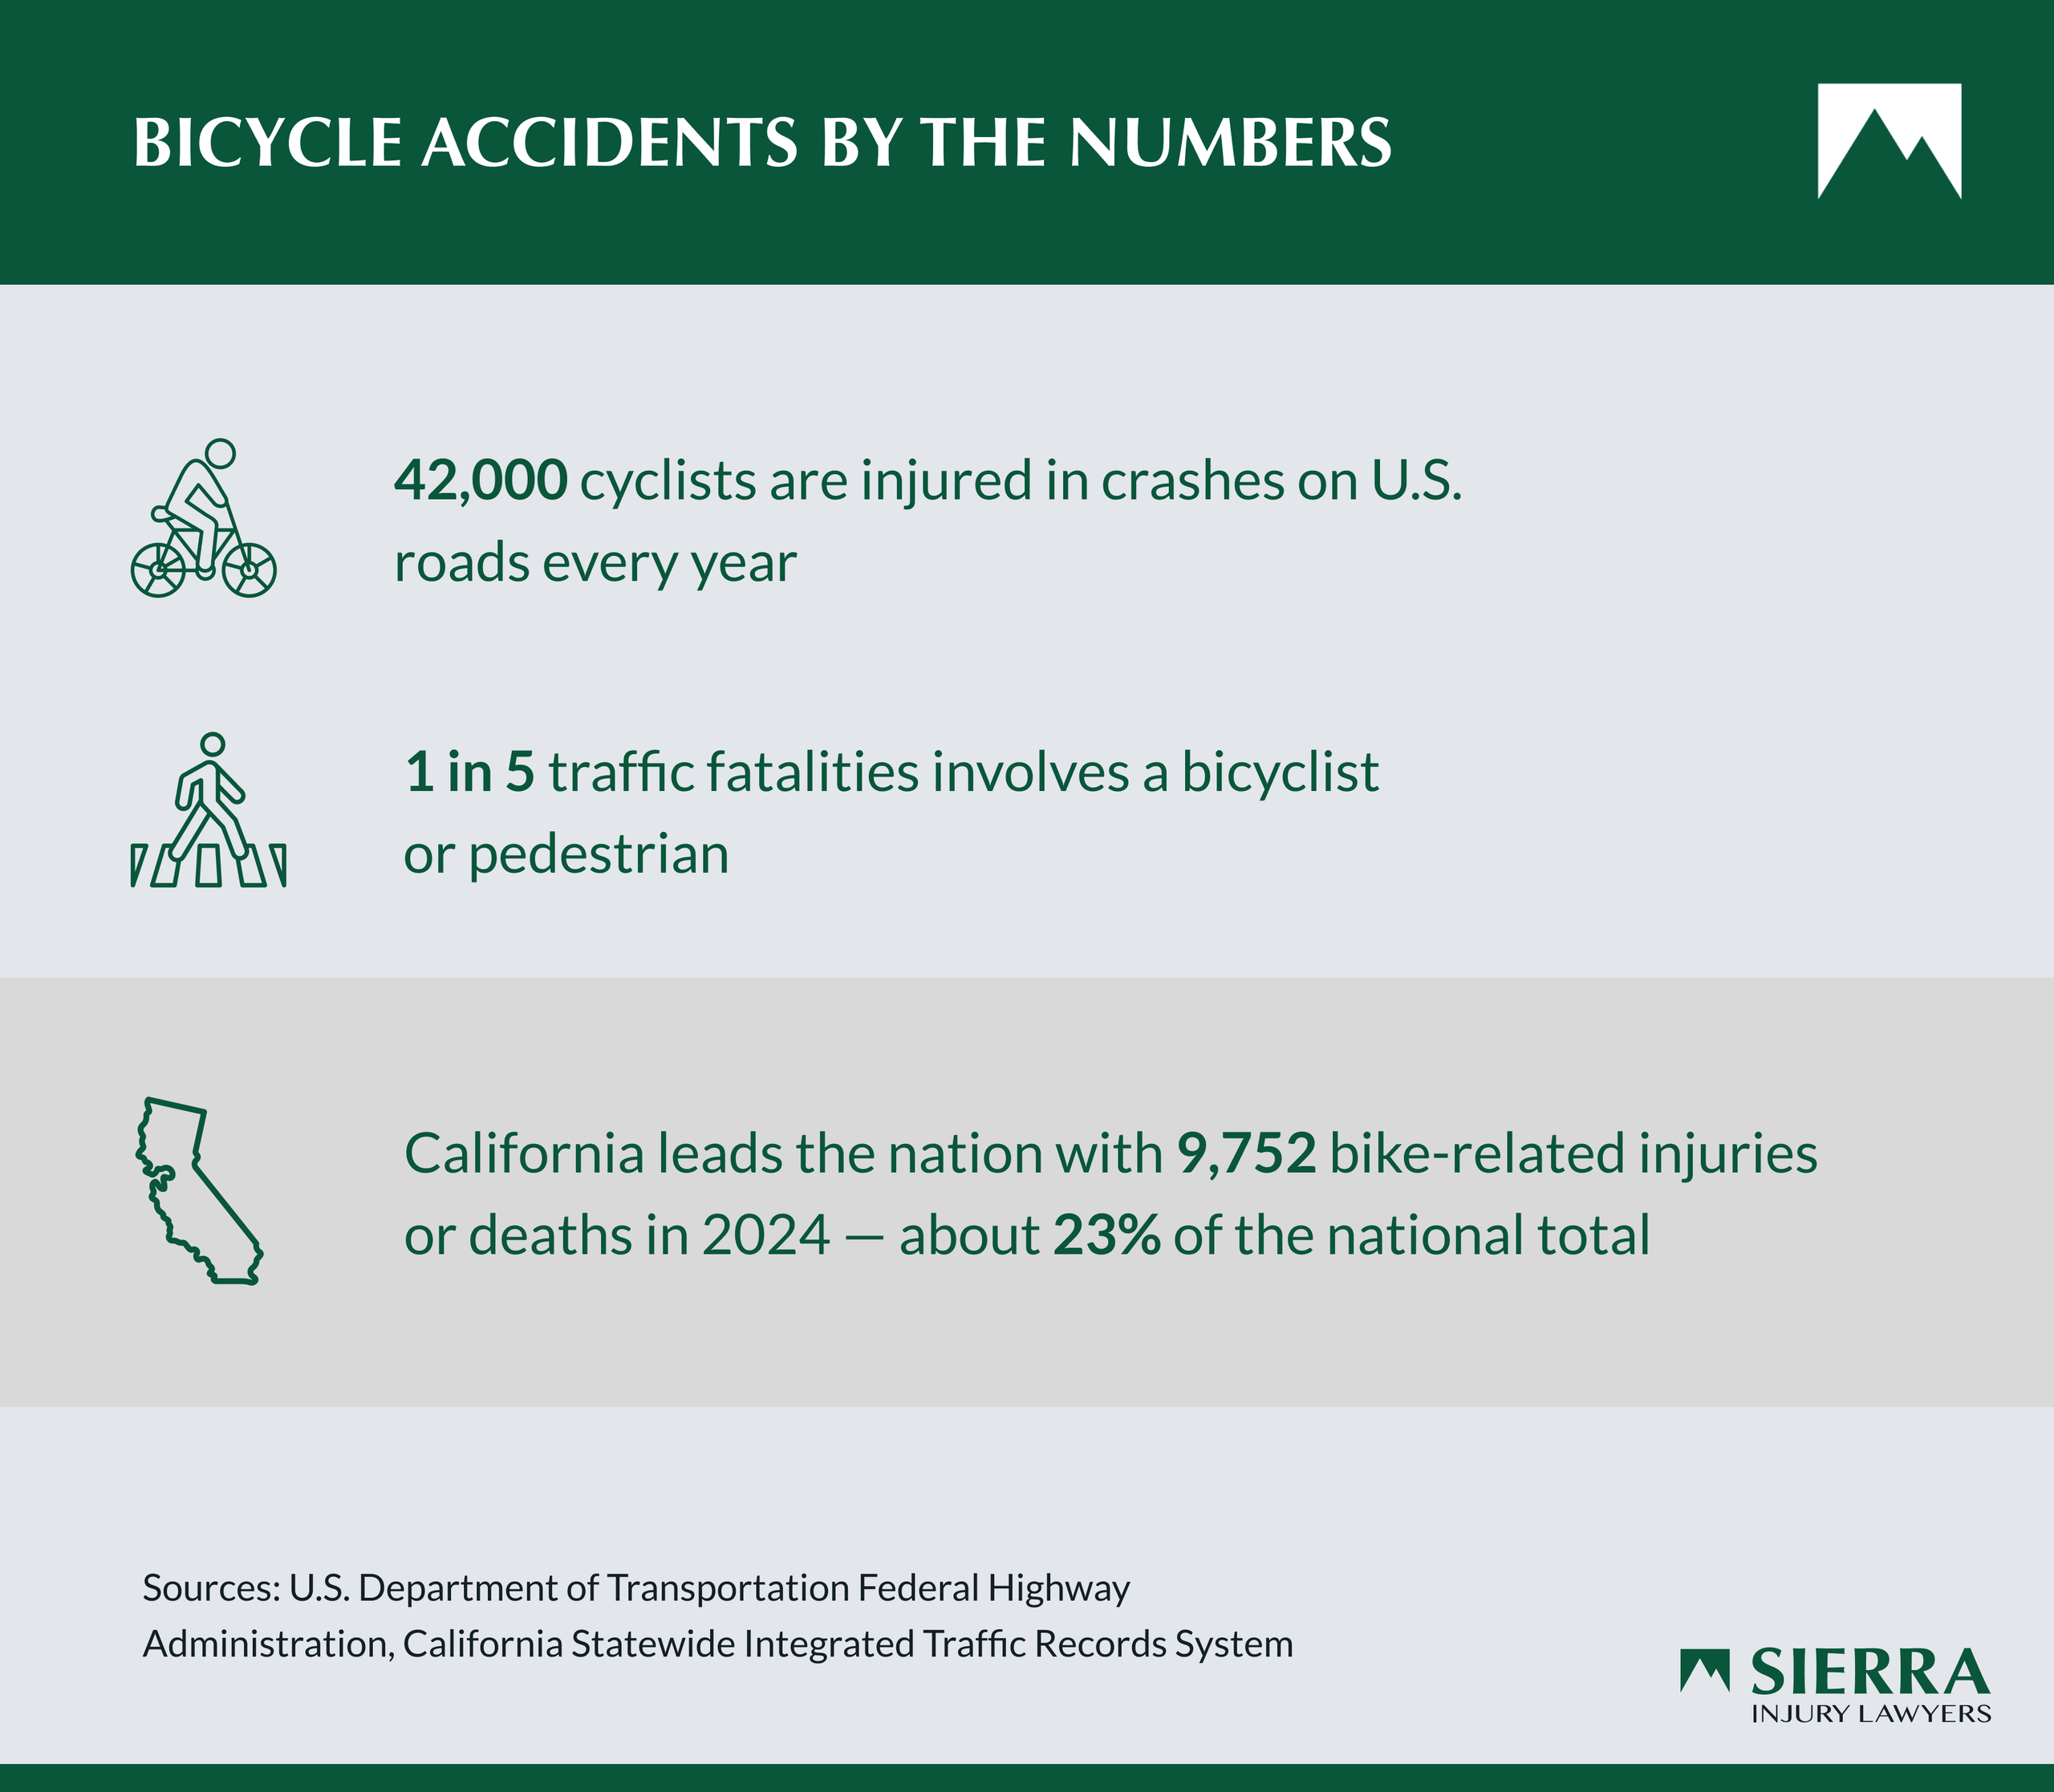
According to the U.S. Department of Transportation Federal Highway Administration (DOT FHA), approximately 42,000 bicyclists are injured in roadway crashes every year. The DOT FHA also reports that bicyclist and pedestrian fatalities account for roughly one out of five traffic fatalities nationally.
By comparison, there were 9,752 bicycle accidents involving any level of injury or death in California in 2024. This means that the state accounts for roughly 23% of nationwide bicycle accident injuries, a figure that is unsurprising given California’s position as the most populated state in the U.S.
While Nevada does not report yearly data on injuries from bicycle accidents, it is generally considered one of the worst states for bicyclists, with a 2024 study by the League of American Bicyclists ranking it 38th in the nation based on infrastructure, safety, and other factors.
How Many People Die From Bicycle Accidents Each Year?
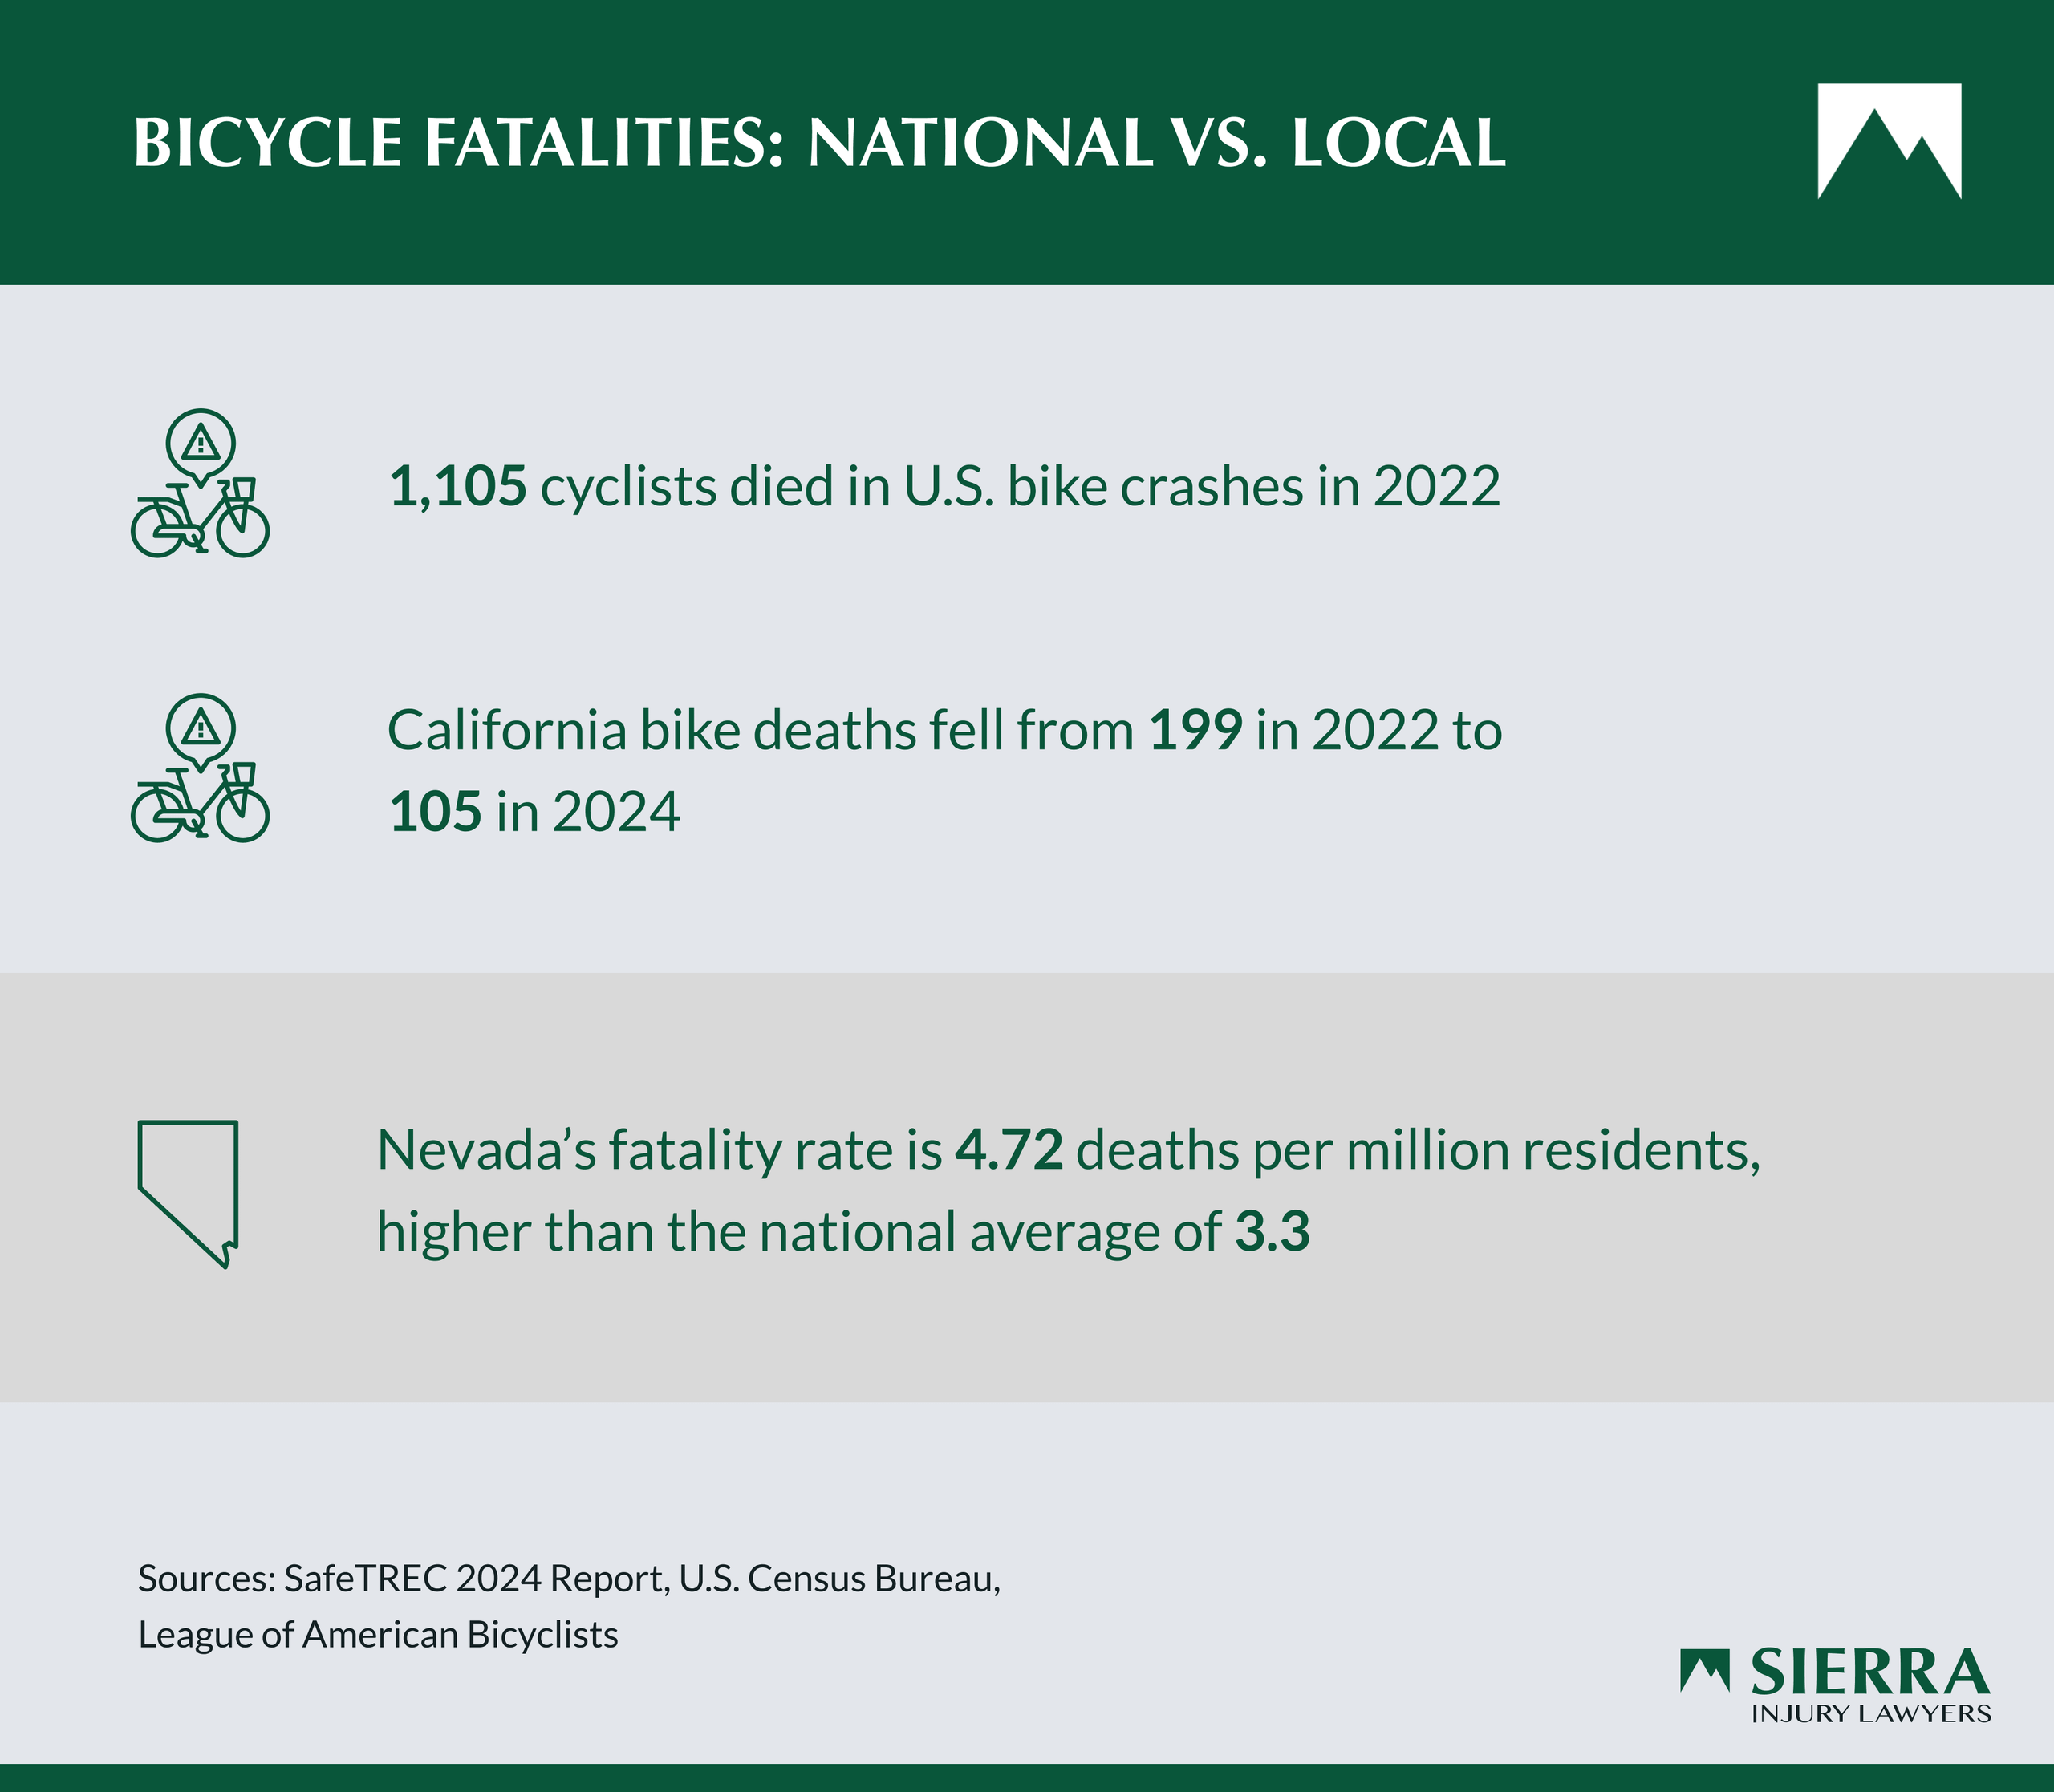
While national bicycle fatality data for 2024 is not yet available, a 2024 SafeTREC report revealed that 1,105 bicyclists were killed nationally in 2022. That same year, California alone saw 199 bicycle accident fatalities. That number is, fortunately, decreasing, dropping to 160 in 2023 and falling to 105 in 2024.
In 2024, 15 bicyclists died in accidents in Nevada. While that figure sounds positive, it is important to account for Nevada’s low population. When bicycle accident claims are examined in that context, it reveals that the fatality rate of Nevada cyclists is 4.72 per one million residents. The national average is 3.3 per one million residents.
What Percent of Bicycle Accidents Involve an Automobile?
Because bike accidents that do not involve a motor vehicle generally go unreported, it is difficult to accurately determine the percentage of total accidents that involve a motor vehicle. However, national data indicates that about 2% of all crash deaths are cyclists.
What Percent of Bicycling Accidents Result in Head Injuries?
According to the National Safety Council, about one-third of non-fatal bicycle injuries are head injuries. Speaking to the effectiveness of helmets, studies have shown that policies that encourage helmet use have resulted in a significant reduction, between 20% to 55%, in bicycle head injuries.
Where Do Most Bicycle Accidents Occur?
The National Highway Traffic Safety Administration (NHTSA) reports that nearly three out of four bicyclist deaths occur in urban settings as opposed to rural areas. California data supports this, showing that the majority of accidents in 2024 occurred in Los Angeles, Orange County, and San Diego, followed by other urban areas.
Although data is less comprehensive for Nevada, a Zero Fatalities report shows that the majority of fatal bicycle accidents in the state have occurred in Clark County, home to the state’s three largest cities.
What Ages Have the Most Injuries From Bicycles?
The NHTSA conducted a 10-year analysis of bicycle accidents and fatalities, which spanned from 2011 to 2020. During that period, the average age of bicyclists who were killed in accidents increased by five years, rising from 43 in 2011 to 48 in 2020.
Cyclists in the 60 to 64 age group had the highest fatality rate. However, cyclists aged 15 to 20 and 10 to 14 had the highest injury rates at 19 per 100,000 and 17 per 100,000, respectively.
What’s the Most Likely Time to Have a Bicycle Accident?
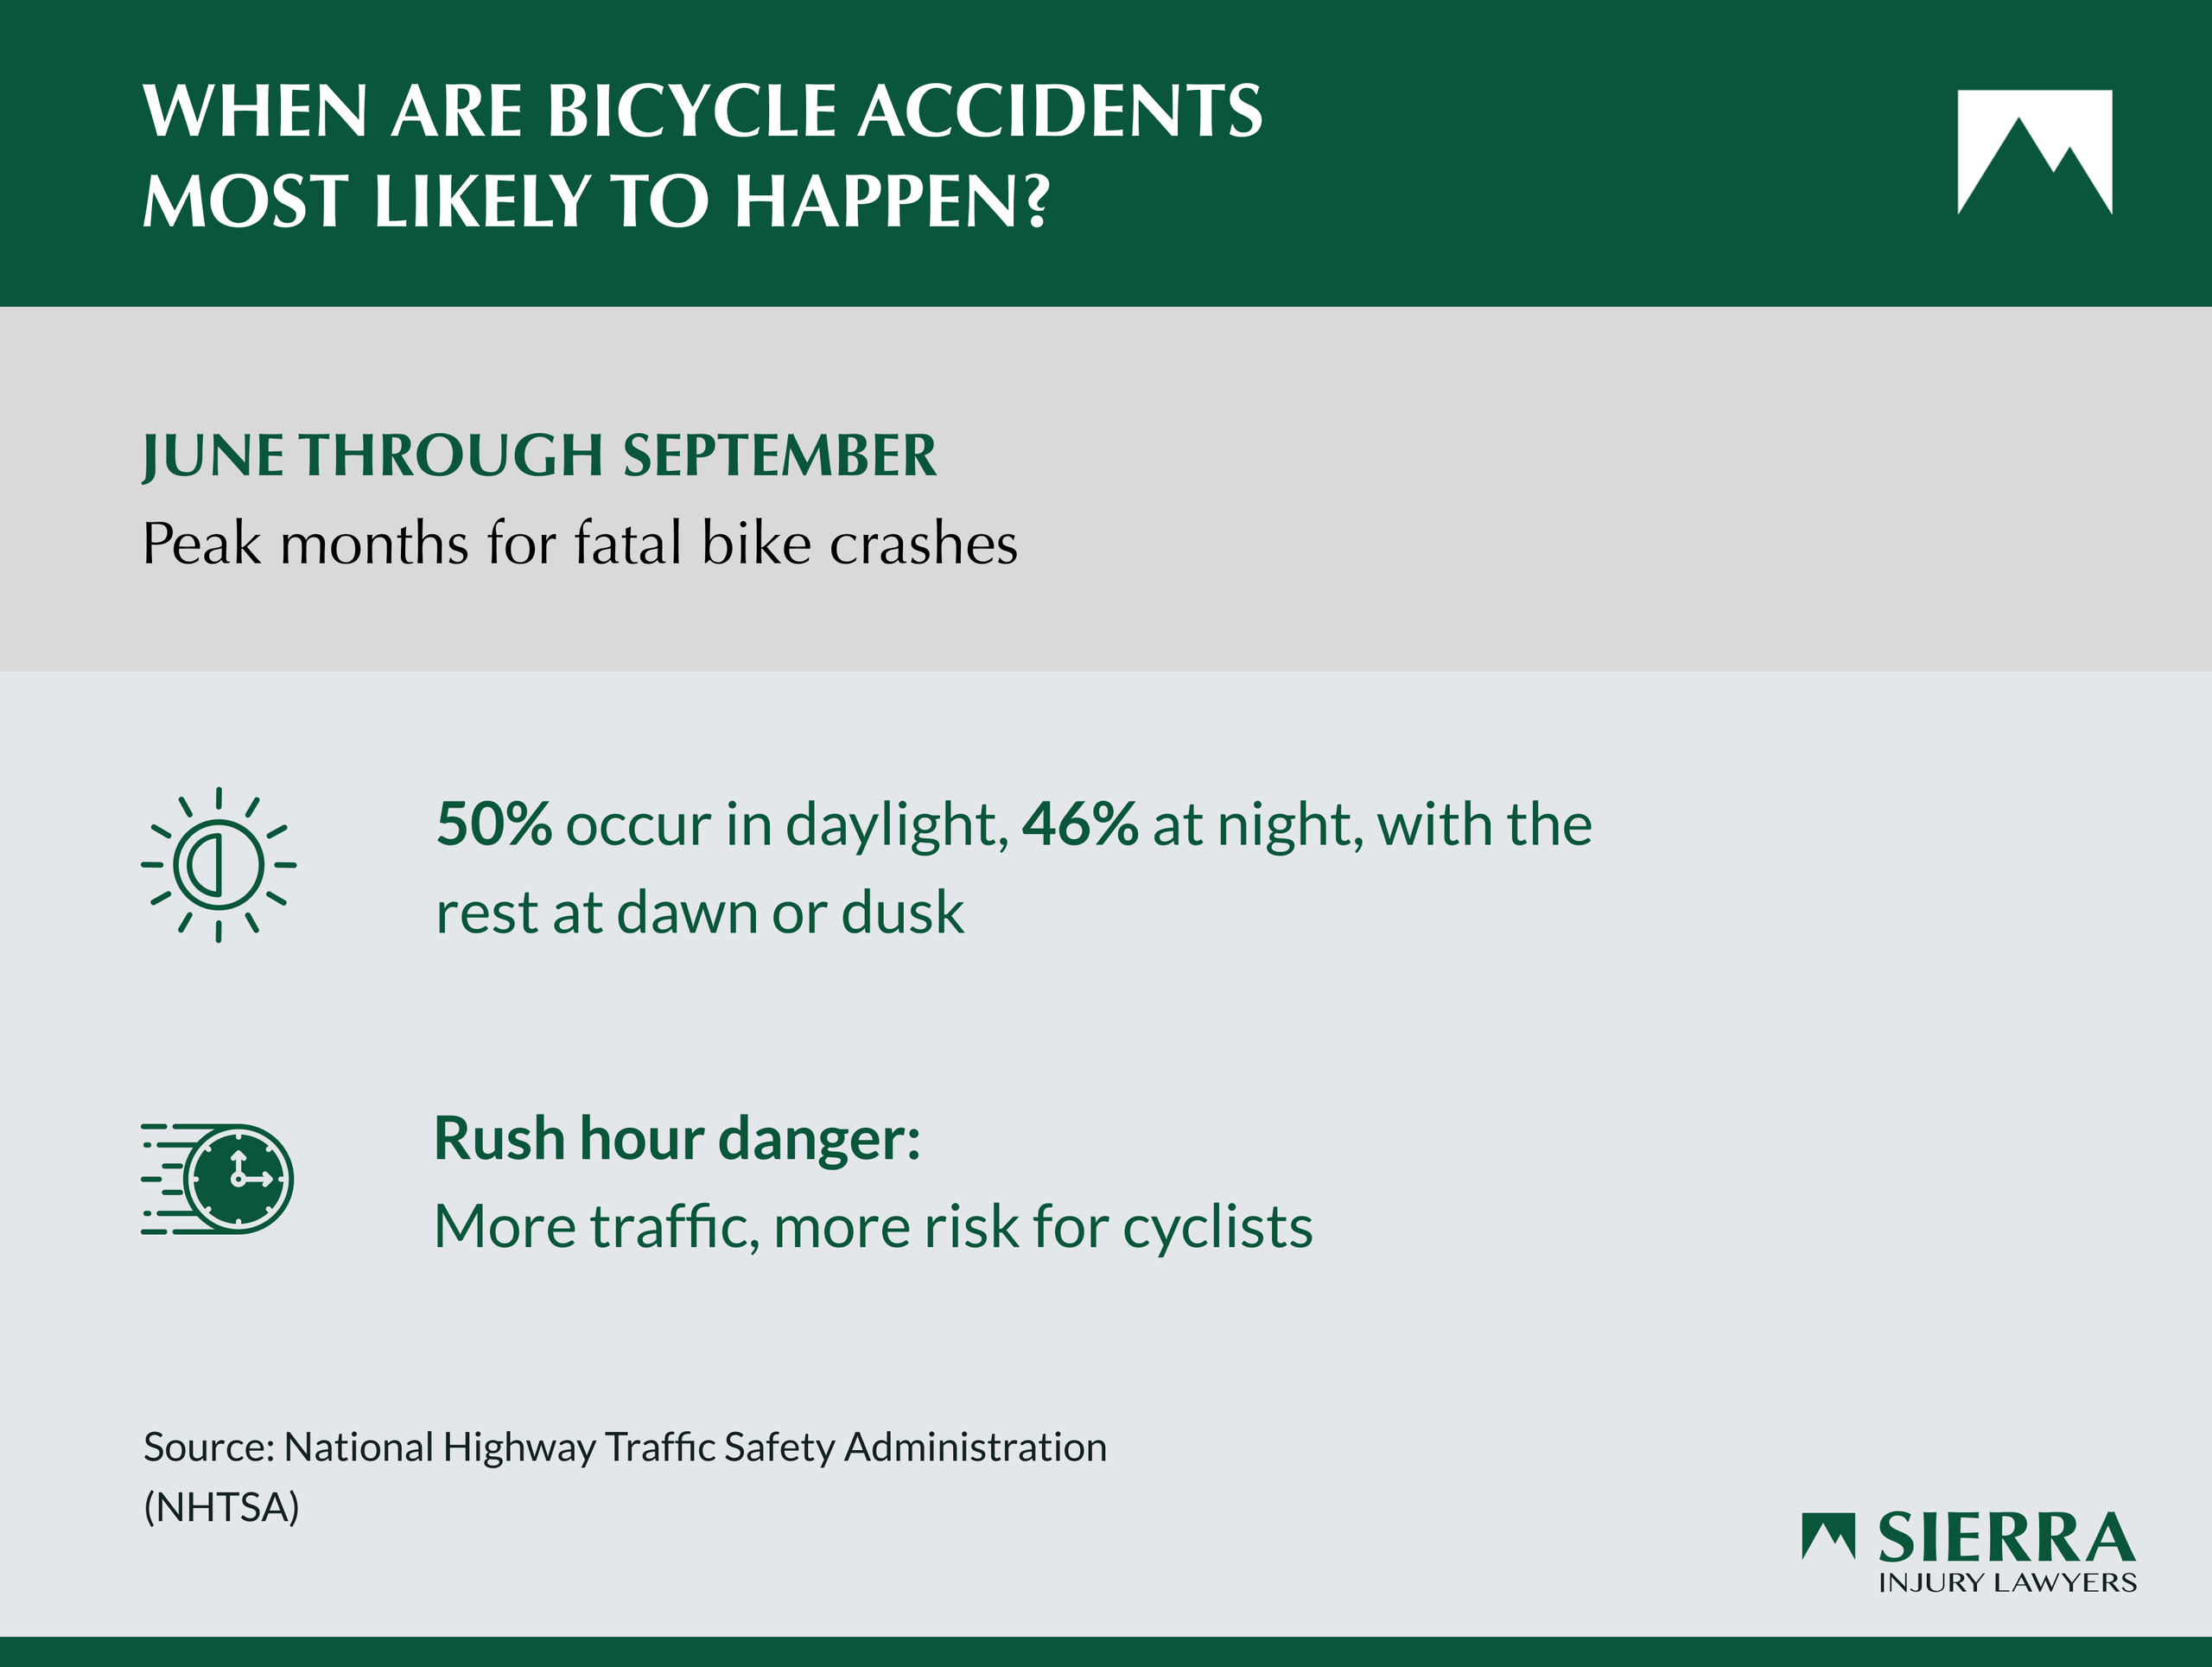
According to the NHTSA, bike fatalities are highest between June and September. This should come as no surprise, as the warmer summer months provide prime biking weather.
The NHTSA also reports that fatalities are nearly evenly split between daylight hours at 50% and dark hours at 46%. Similarly, 2% of deaths occurred during dawn hours, and 3% occurred during dusk hours. Rush hour may be more risky for bicyclists due to the increased congestion on major roadways.
What Are the Most Common Causes of Bicycle Accidents?
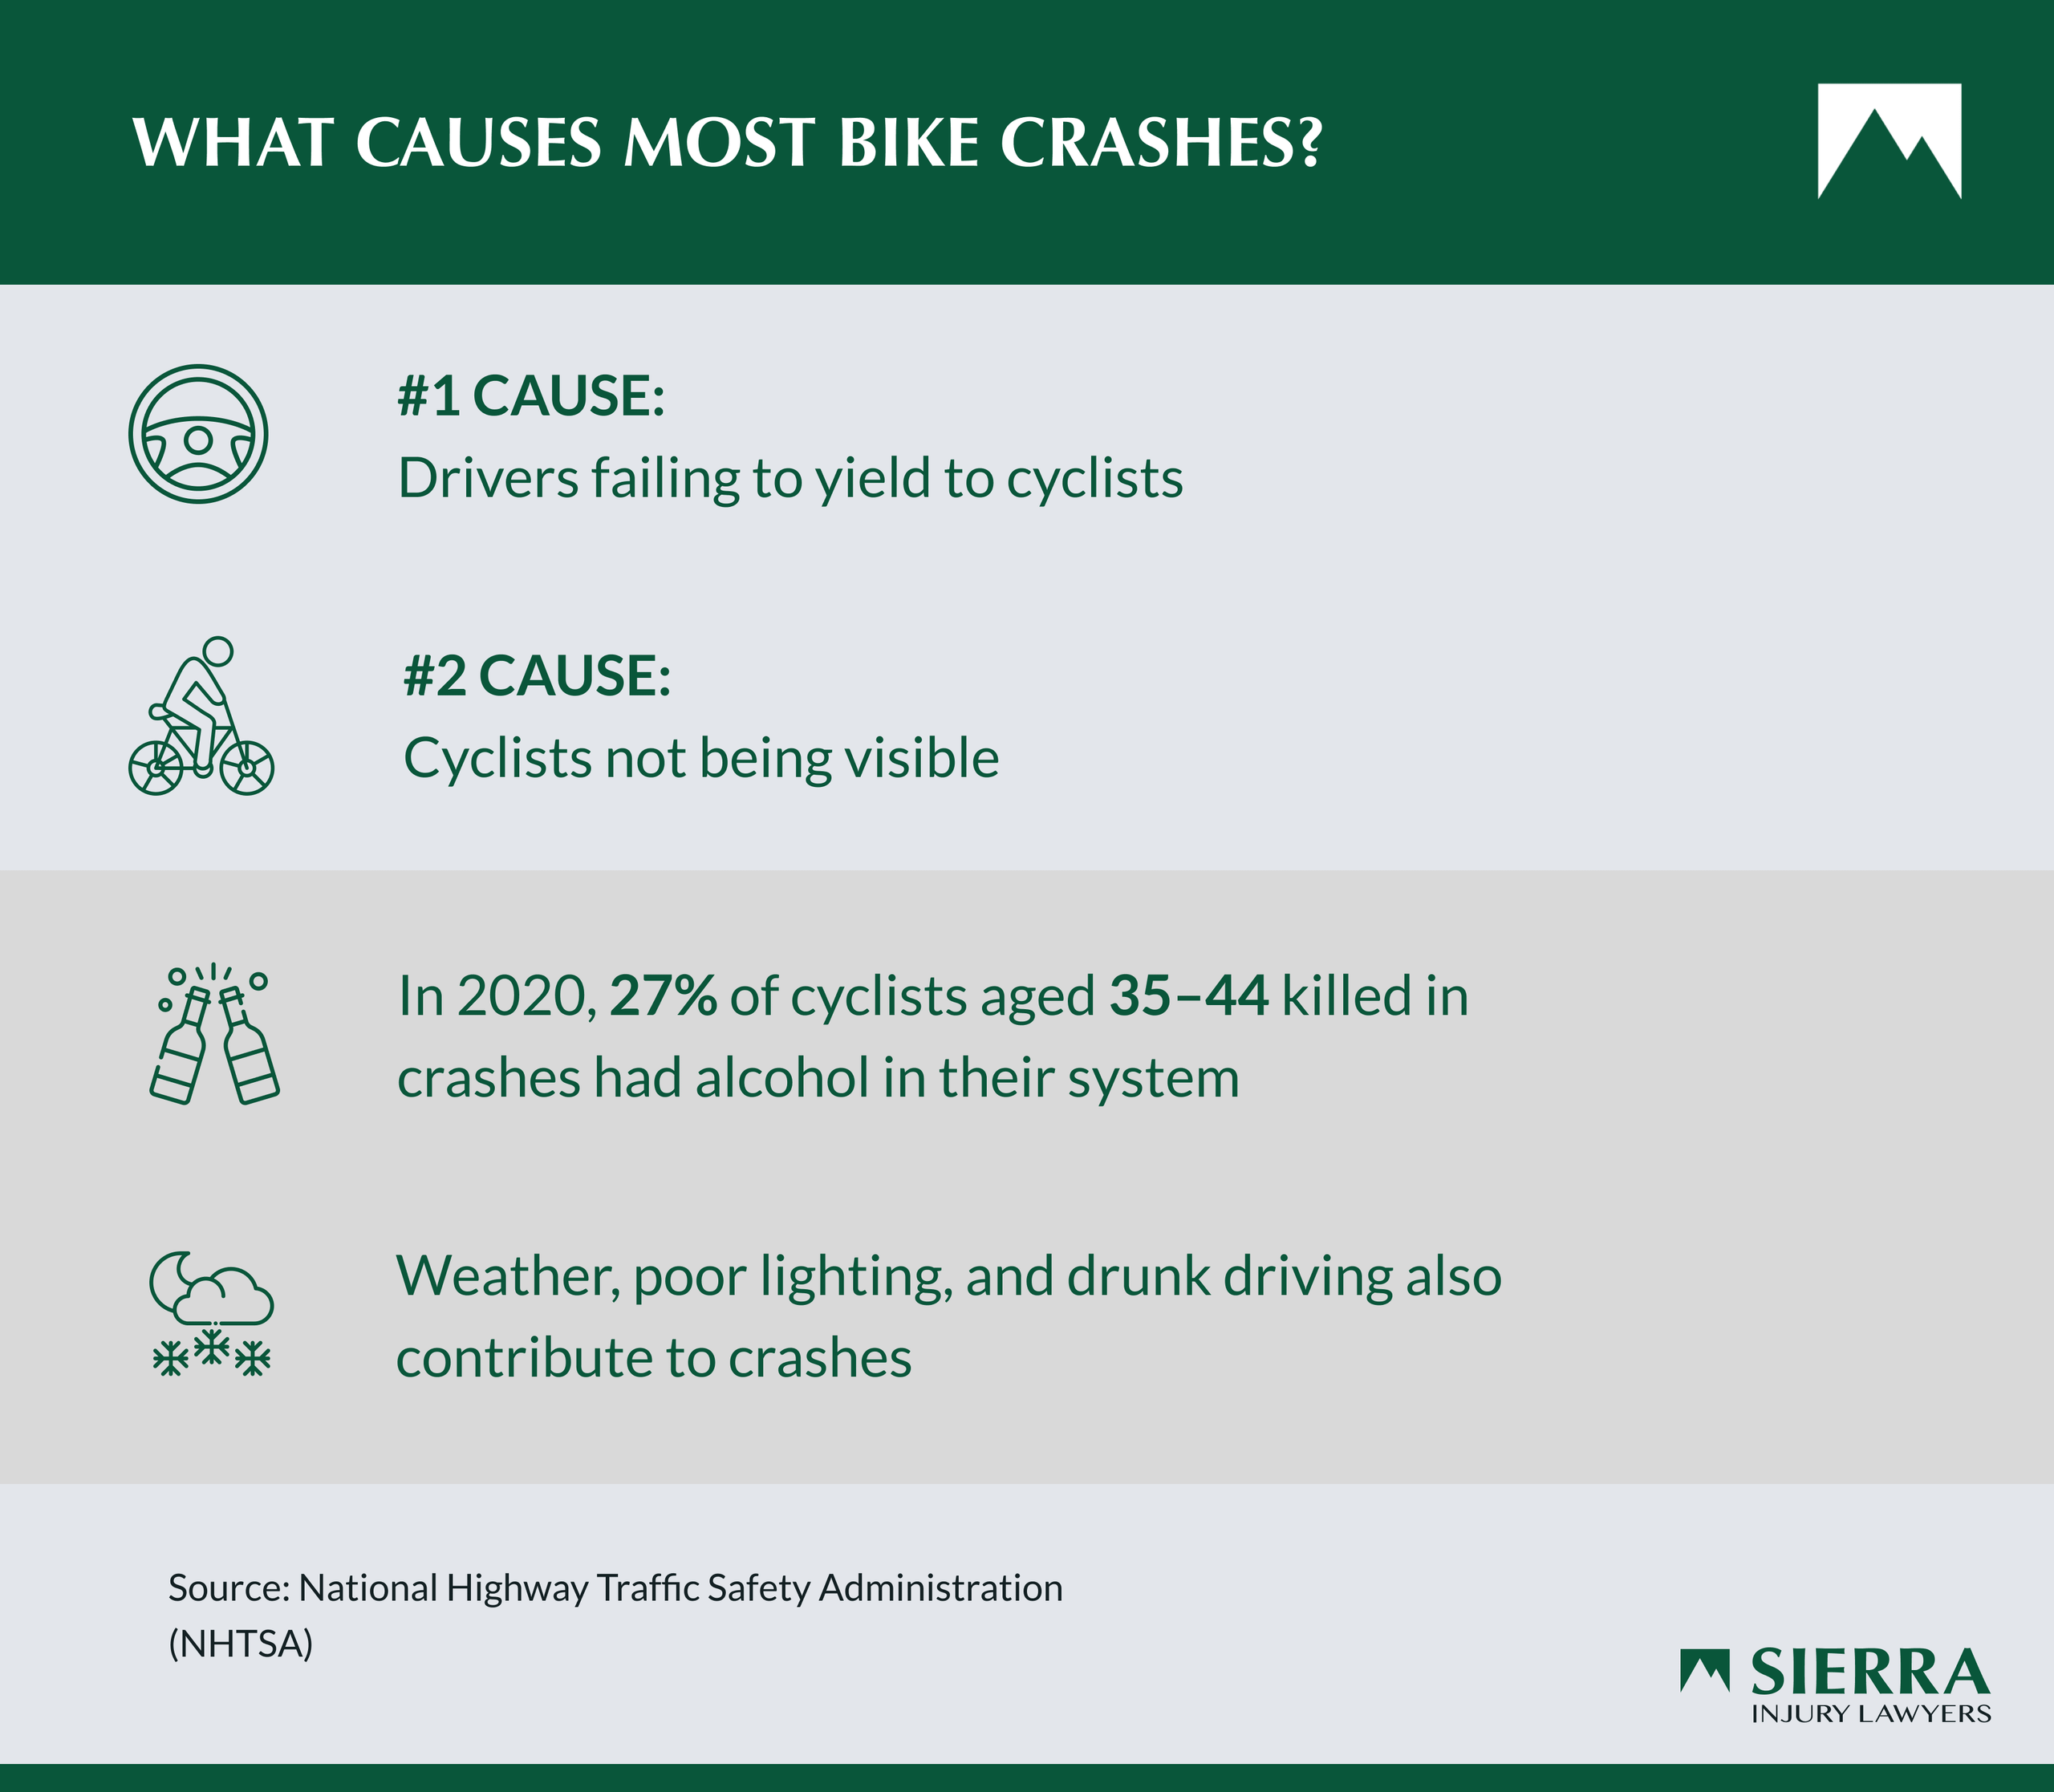
The NHTSA notes that the most common factor involved in fatal bicycle crashes was failing to yield the right-of-way. The second most common factor was cyclists not being visible to drivers.
While motorists are responsible for looking out for cyclists, bike riders are also responsible for ensuring they are visible, especially when riding in low light. Other potential causes of bicycle accidents include poor weather and impaired driving.
In the 10-year analysis conducted by NHTSA, researchers also examined alcohol involvement in both cyclists and drivers. In 2020, 27% of cyclists aged 35 to 44 who died in bike crashes had a blood alcohol content of 0.08g/dL or higher, and 13% of drivers involved in fatal bike crashes had a BAC of 0.08 g/dL or higher.
If You’ve Been Hit While Bicycling in Truckee-Tahoe, Talk to Our Bicycle Accident Lawyers
The numbers don’t lie—bicycle accidents in California and Nevada are far too common. If you’ve been injured in a bicycle crash in Truckee-Tahoe, our experienced attorneys can help you take the next step in your recovery. Our team has a long-standing track record of delivering results for our clients. Contact us today to schedule a free consultation.
Article Sources
-
U.S. Department of Transportation Federal Highway Administration
https://highways.dot.gov/safety/pedestrian-bicyclist -
UC Berkeley
https://tims.berkeley.edu/summary.php -
League of American Bicyclists
https://bikeleague.org/wp-content/uploads/2024/12/BFS_Report_2024-1.pdf -
UC Berkeley
https://safetrec.berkeley.edu/2024-safetrec-traffic-safety-facts-bicycle-safety -
KTNV
https://www.ktnv.com/news/could-this-proposed-bill-decrease-cyclist-fatalities-in-nevada-advocates-think-it-can -
Reno Gazette Journal
https://www.rgj.com/story/news/data/2024/11/26/is-nevada-bad-for-bicyclists-studies-paint-a-mixed-picture/76478281007/ -
Insurance Institute for Highway Safety
https://www.iihs.org/topics/fatality-statistics/detail/bicyclists -
National Safety Council
https://www.nsc.org/safety-first/bicycle-safety-statistics-may-surprise-you -
U.S. Centers for Disease Control and Prevention
https://www.cdc.gov/mmwr/volumes/70/wr/mm7019a1.htm -
Zero Fatalities Nevada
https://zerofatalitiesnv.com/app/uploads/2024/11/2024-11-07-Nevada-Crash-Facts.pdf -
National Highway Traffic Safety Administration
https://crashstats.nhtsa.dot.gov/Api/Public/ViewPublication/813322.pdf -
National Highway Traffic Safety Administration
https://www.nhtsa.gov/road-safety/bicycle-safety